目次
概要
以前の記事で、Ubuntuサーバーの監視を行いました。
次はWindowsサーバーの監視の設定を行います。
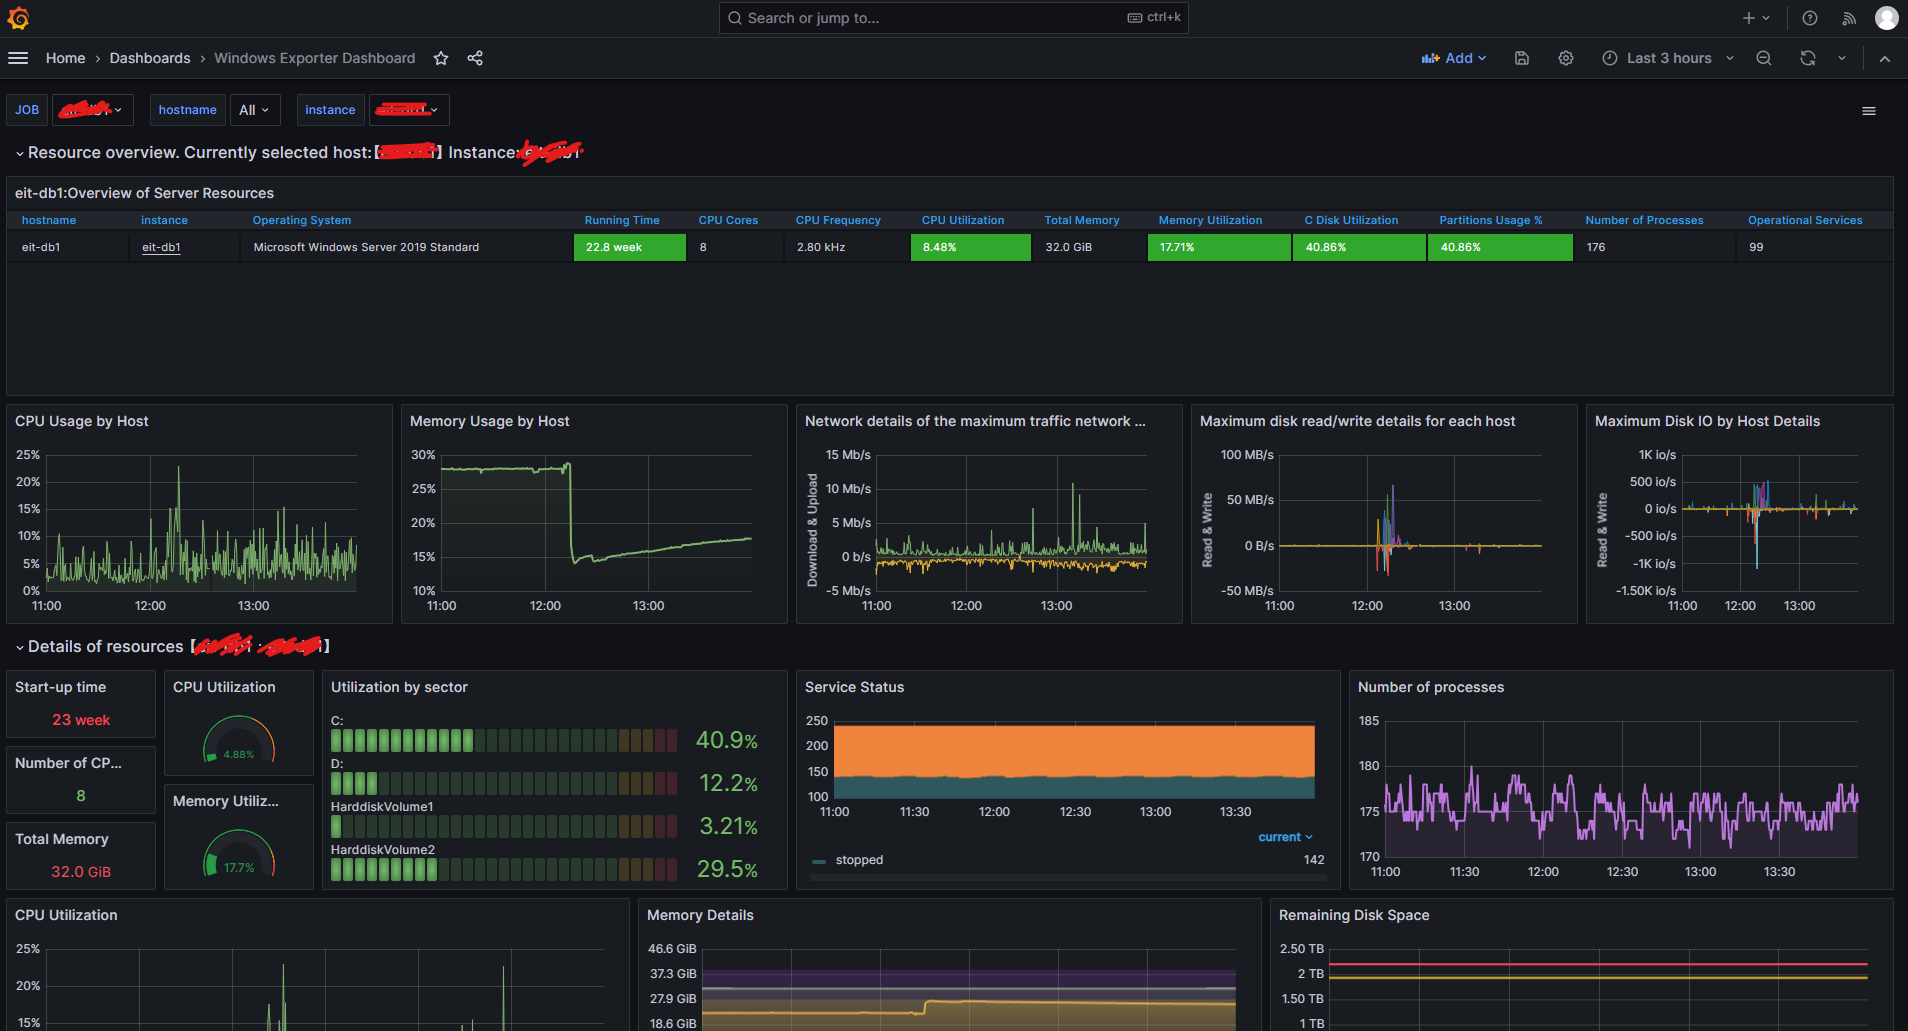
こんな感じのDashboard
を作って、閾値を超えたらアラートメールを飛ばします。
手順
1. Grafanaのインストール
https://grafana.com/grafana/download?platform=windows&edition=oss
よりインストーラを取得してインストールします。
http://localhost:3000/ にアクセスしてインストールの確認をします。
2. WMI Exporter のインストール
https://github.com/prometheus-community/windows_exporter/releases
からインストーラをダウンロードしてインストールします。
http://localhost:9182/metrics
にアクセスしてメトリクスが取得できているか確認します
3. Prometheusのインストール
https://prometheus.io/download/
からファイルを解凍し、
prometheus.yamlを編集します。
scrape_configs:
  # The job name is added as a label `job=<job_name>` to any timeseries scraped from this config.
  - job_name: "wmi_exporter"

    # metrics_path defaults to '/metrics'
    # scheme defaults to 'http'.

    static_configs:
      - targets: ["localhost:9182"]
4. NSSMのインストール
https://nssm.cc/download
nssmアプリケーションをPrometheusをインストールしたディレクトリに配置します。
5. PromethusをWindowsサービスとして起動
コマンドプロンプトを管理者権限で起動し、インストールしたディレクトリにて下記を実行します。
>nssm.exe install Prometheus C:\から始まるprometheus.exeへのフルパス --config.file=prometheus.yml --web.listen-address=:9090
Service "Prometheus" installed successfully!
http://localhost:9090/targets?search=
にてwmi_exporterがUPになっていることを確認します。
6. Prometheusをデータソースとして、ダッシュボードを作成またはインポート
ダッシュボードを作成もしくは公開されているダッシュボードをインポートします。
私は下記を利用しました。
https://grafana.com/grafana/dashboards/20763-windows-exporter-dashboard-2024/
7. default.iniをコピーしてcustom.iniとして保存
アラートメールを飛ばす設定をします。
SMTPの欄を修正。Grafanaを一度閉じて、powershellにて下記を実行します。
PS C:\Program Files\GrafanaLabs\grafana> bin/grafana-server --config conf/custom.ini- https://mtzk.me/grafana/#5-3-set-up-grafanaini
- https://grafana.com/docs/grafana/latest/setup-grafana/configure-grafana/
FAQ
Q. PCを再起動したら、Grafanaにつながりません
A. powershellでGrafanaを再起動します
PS C:\windows\system32> Get-Service -Name Grafana

Status   Name               DisplayName
------   ----               -----------
Stopped  Grafana            Grafana


PS C:\windows\system32> Start-Service -Name Grafana
PS C:\windows\system32> Get-Service -Name Grafana

Status   Name               DisplayName
------   ----               -----------
Running  Grafana            Grafana
最後に
Likeボタンが押せなくなっているのは、Lyketというサービスの無料利用期間が終わってしまったためです。
たぶん自分で実装したほうが安上がりなので、近々実装します。